Conversions Report
View conversion events in real-time, visualize complete customer journeys, and identify which ads drove each conversion. Filter events by integration, event name, or customer ID to trace the path to purchase.
The Conversions Report in AnyTrack displays all conversion events collected through your integrations, shows customer journeys end-to-end, and identifies the exact ad each visitor clicked before landing on your website.
Quick Overview
Section titled “Quick Overview”Learn how to use the Conversions Report in two minutes.
Access the Conversions Report
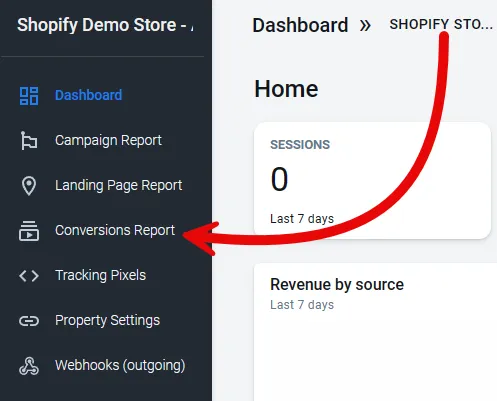
Section titled “Access the Conversions Report”Open the AnyTrack dashboard, select a <glossary:Property>, and click Conversions Report in the left menu.
At the top of the Conversions Report page, you will find the following elements:
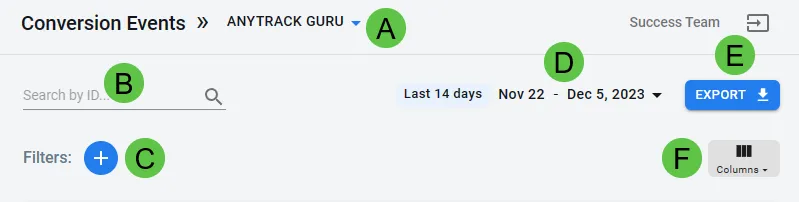
| A | Property selector | Displays the selected <glossary:Property> for which the Conversions Report is showing data. Click to select a different Property. |
| B | Search by ID | Search by <glossary:Client ID> or <glossary:Click ID>. The page displays only events associated with that ID, focusing on a specific customer journey. |
| C | Filters | Filter by Event Name and/or Integration. Display only ‘Purchase’ events or events from a specific integration like ‘ClickBank’. Add multiple filters by clicking +. |
| D | Time frame selector | Select the timeframe for displayed events: Today, Yesterday, Last 7/14/28 days, This month, Last month, or Custom. |
| E | Export as file | Export report data as JSON or CSV. The file includes only currently displayed events. |
| F | Columns selector | Choose which columns to display. Select a predefined set (Common, Campaigns, Landing Pages) or customize columns. Click Save current as default to preserve your selection. |
Events
Section titled “Events”Each line in the report represents a different user and the event they generated on your website. Filter these events by integration and/or event name.
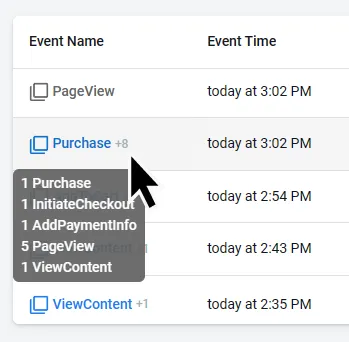
Grouped Events
Section titled “Grouped Events”Some events are grouped because they share the same User ID. Grouped events show a + icon and a number. Hover over the group to see a breakdown of the events. The event displayed is the most significant in the group.
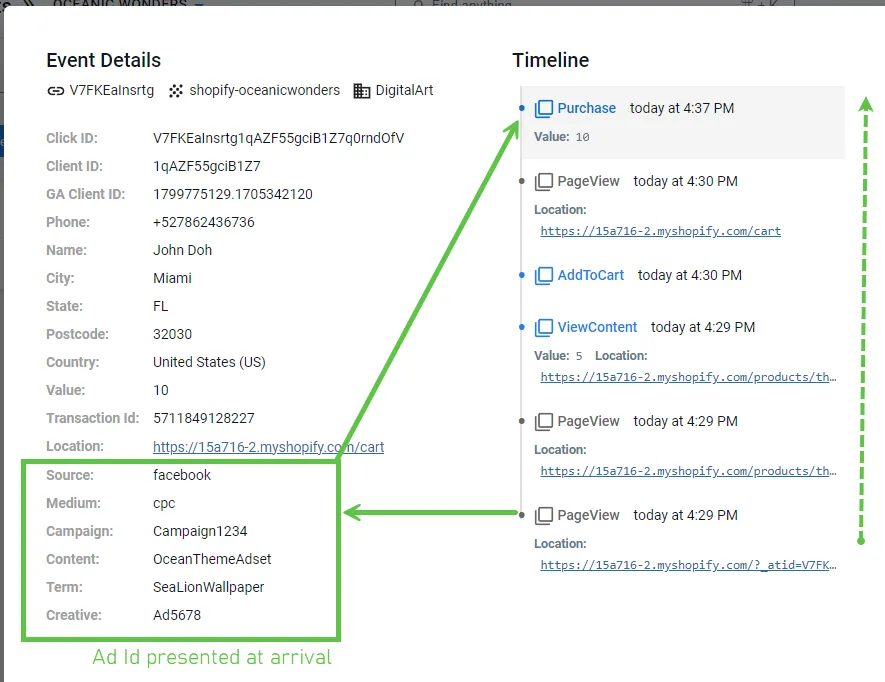
Event Details and Timeline
Section titled “Event Details and Timeline”Click any event or group of events to open the Event Details panel. It shows conversion event data, campaign identifiers, and a Timeline. Use the Timeline to review customer journeys across your pages and integrations.
The Event Details panel also shows the customer’s identity — name, email, and other traits — whenever the source integration or webhook included them in the conversion payload. This appears when you open a specific event, not as a column in the main list, so click into a conversion to see who it belongs to.
Related Resources
Section titled “Related Resources”Frequently Asked Questions
FAQ was last reviewed on 2026-08-01