Landing Page Report
Analyze landing page performance in AnyTrack. Track visitor journeys from entry point through conversion. Filter by landing pages, pages viewed, tracked elements, and keywords. Optimize pages with high traffic but low conversion rates.
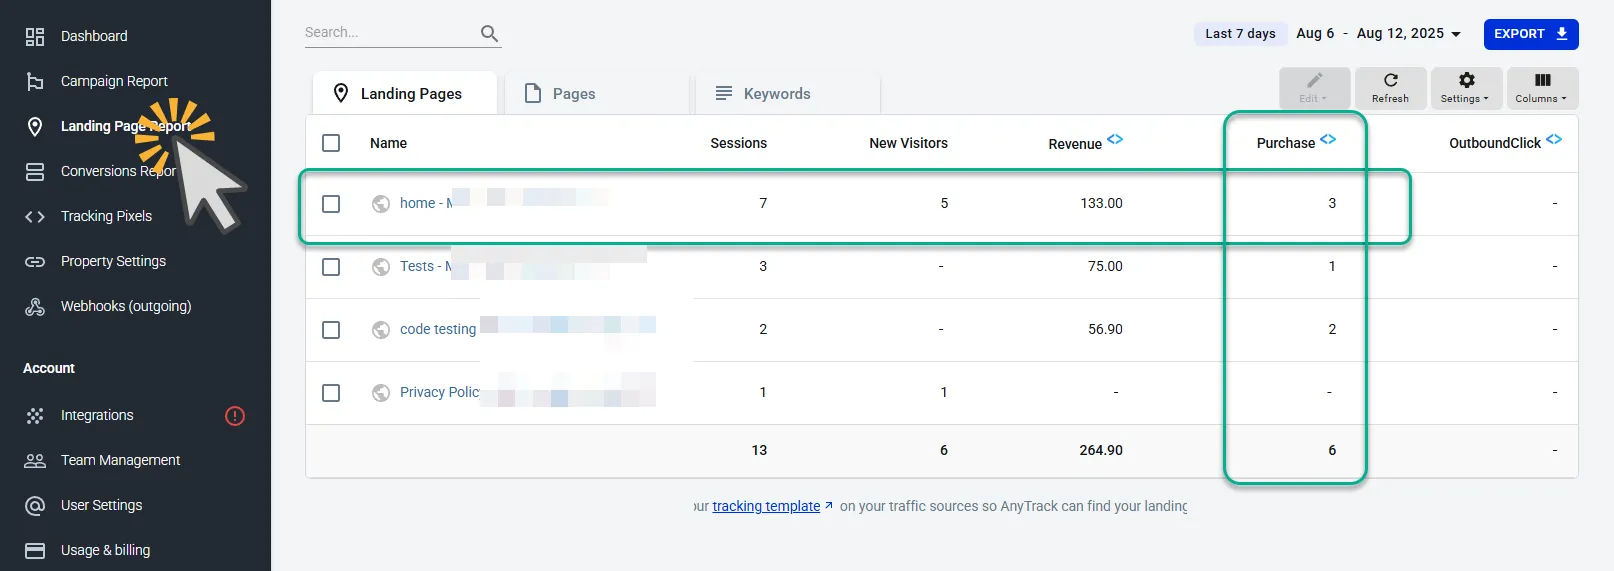
The Landing Page Report tracks the first page visitors land on and shows what happens next—subsequent pages viewed, interactions with tracked elements like Add to Cart or signup forms, and the keywords that drove the visit. Understand how each entry page influences downstream visitor behavior and conversions.
Report Views
Section titled “Report Views”The Landing Page Report offers four views to analyze performance:
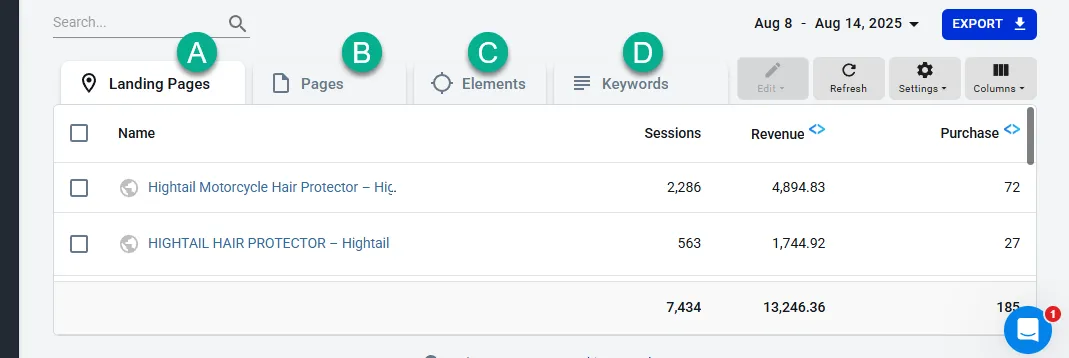
A) Landing Pages . The first pages visitors reach from ads, email, or other sources. Metrics focus on acquisition: sessions, new visitors, and conversions at the entry point.
B) Pages . All pages on your site that receive tracked traffic, whether entry point or part of a visitor’s journey. Shows performance throughout the funnel, including pages visited after the landing page.
C) Elements . Tracked user interaction points or URLs (buttons, forms, checkout steps, specific paths) that aren’t full landing pages. Monitor performance for specific funnel steps and key site actions.
D) Keywords . Search terms or ad keywords that drove traffic to your site, pulled from ad platform tracking parameters like Google Ads’ {keyword} token.
Customize Columns
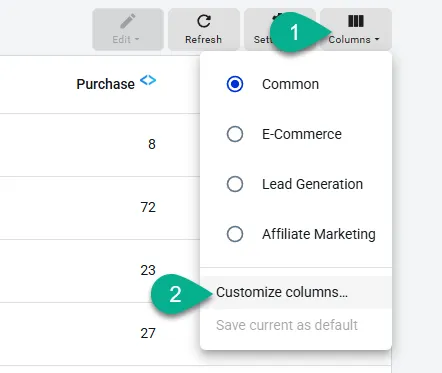
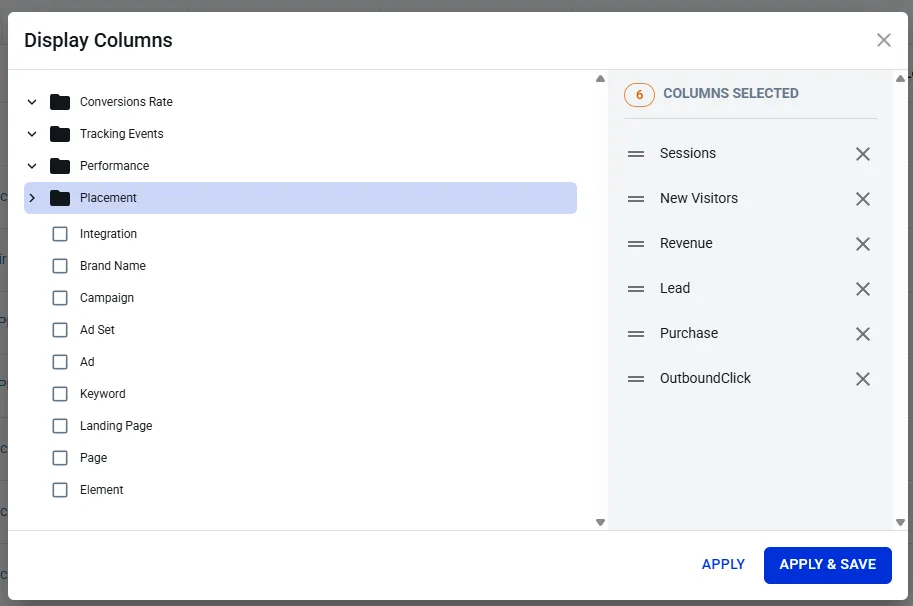
Section titled “Customize Columns”Add dozens of columns from four categories: Conversion Rate, Tracking Events, Performance, and Placement.
Key Use Cases
Section titled “Key Use Cases”Identify High-Performing Pages . Track user journeys from ad click to landing page to conversion. See which landing pages generate the most conversions at what cost.
Track Visitor Behavior . AnyTrack automatically tracks visitors landing on specific pages and attributes conversion events (form submissions, signups, sales) to those pages. View traffic volume, conversion rates, and revenue per landing page.
Filter and Export Data . Filter by event names, sources, or integrations for detailed insights. Customize columns and export data for further analysis.
Optimize Campaigns . Use insights to optimize campaigns, boost ROAS, and allocate budget effectively.
Multi-Touch Attribution . AnyTrack uses server-side and client-side tracking for reliable attribution. Avoid missing touchpoints due to browser restrictions or ad blockers.
Filtering and Analysis
Section titled “Filtering and Analysis”Filter landing page data by:
- Campaign names and IDs
- Traffic sources (Google Ads, Meta Ads, organic, etc.)
- UTM Parameters (source, medium, campaign, content, term)
- Event types and conversion goals
- Date ranges and time periods
Identifying Underperforming Pages
Section titled “Identifying Underperforming Pages”Use these approaches:
- Conversion rate analysis . Find pages with high traffic but low conversion rates
- Cost efficiency . Spot pages with high CPA that need optimization
- Revenue per visitor . Identify pages that underperform against potential
- Bounce rate analysis . Pages where visitors leave without engaging need UX improvements
- Traffic source comparison . See how the same landing page performs across different sources
- A/B testing prioritization . Determine which pages benefit most from testing
- Funnel analysis . Identify where visitors drop off in your conversion process